Weather forecasts play a vital role in our daily lives. Whether we plan to go out for a picnic or commute to work, accurate weather predictions are necessary. We have all seen the percentages mentioned in weather reports, but do we actually understand what they mean?
In this article, we will explore the basics of how meteorologists calculate and interpret percentages in weather forecasts, debunk common misconceptions and offer insights into key concepts related to weather forecasts.
The Basics of Weather Forecast Percentages
Weather forecasts are an essential part of our daily lives, as they help us plan our activities and prepare for any upcoming weather changes. These forecasts are often presented in the form of percentages, which indicate the likelihood of various weather conditions during a particular time period.
Let’s take a closer look at some of the most common percentages mentioned in weather forecasts.
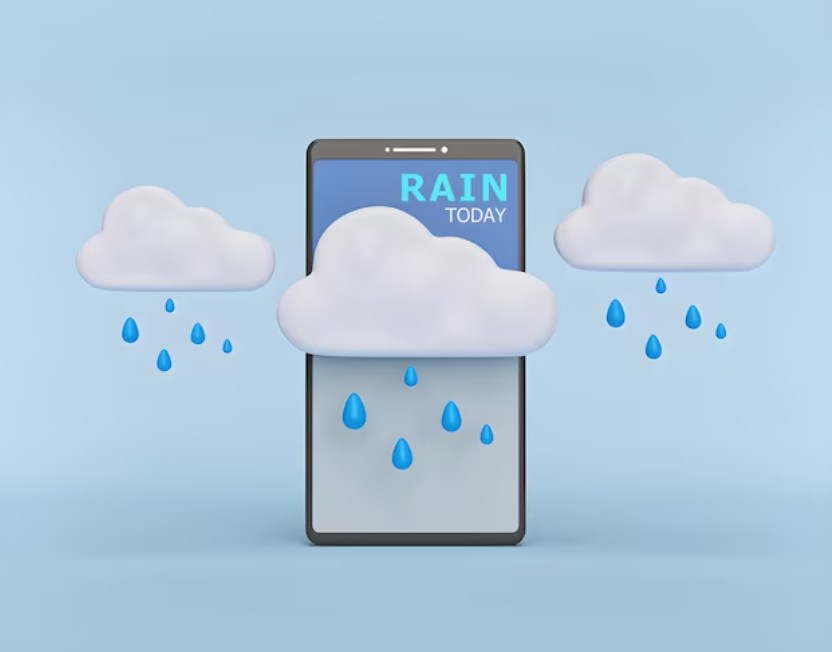
Probability of Precipitation (PoP)
One of the most common percentages mentioned in weather forecasts is the probability of precipitation, also known as PoP. It is expressed as a percentage indicating the likelihood of any measurable precipitation (rain, hail, or snow) within a particular area or region.
A 50% PoP indicates that there are chances of precipitation in half of the expected area during the forecast period. Similarly, a 20% PoP indicates a lower chance of precipitation, and an 80% PoP indicates a higher chance of precipitation. It is important to note that the PoP percentage is not an indication of how much precipitation will occur, but merely how likely it is to occur.
For example, a 50% PoP means that there is a 50% chance of rain during the forecast period. However, it does not mean that it will rain for 50% of the forecast period, or that the amount of rain will be 50% of what is expected. It simply means that there is a 50% chance of measurable precipitation occurring in the area.
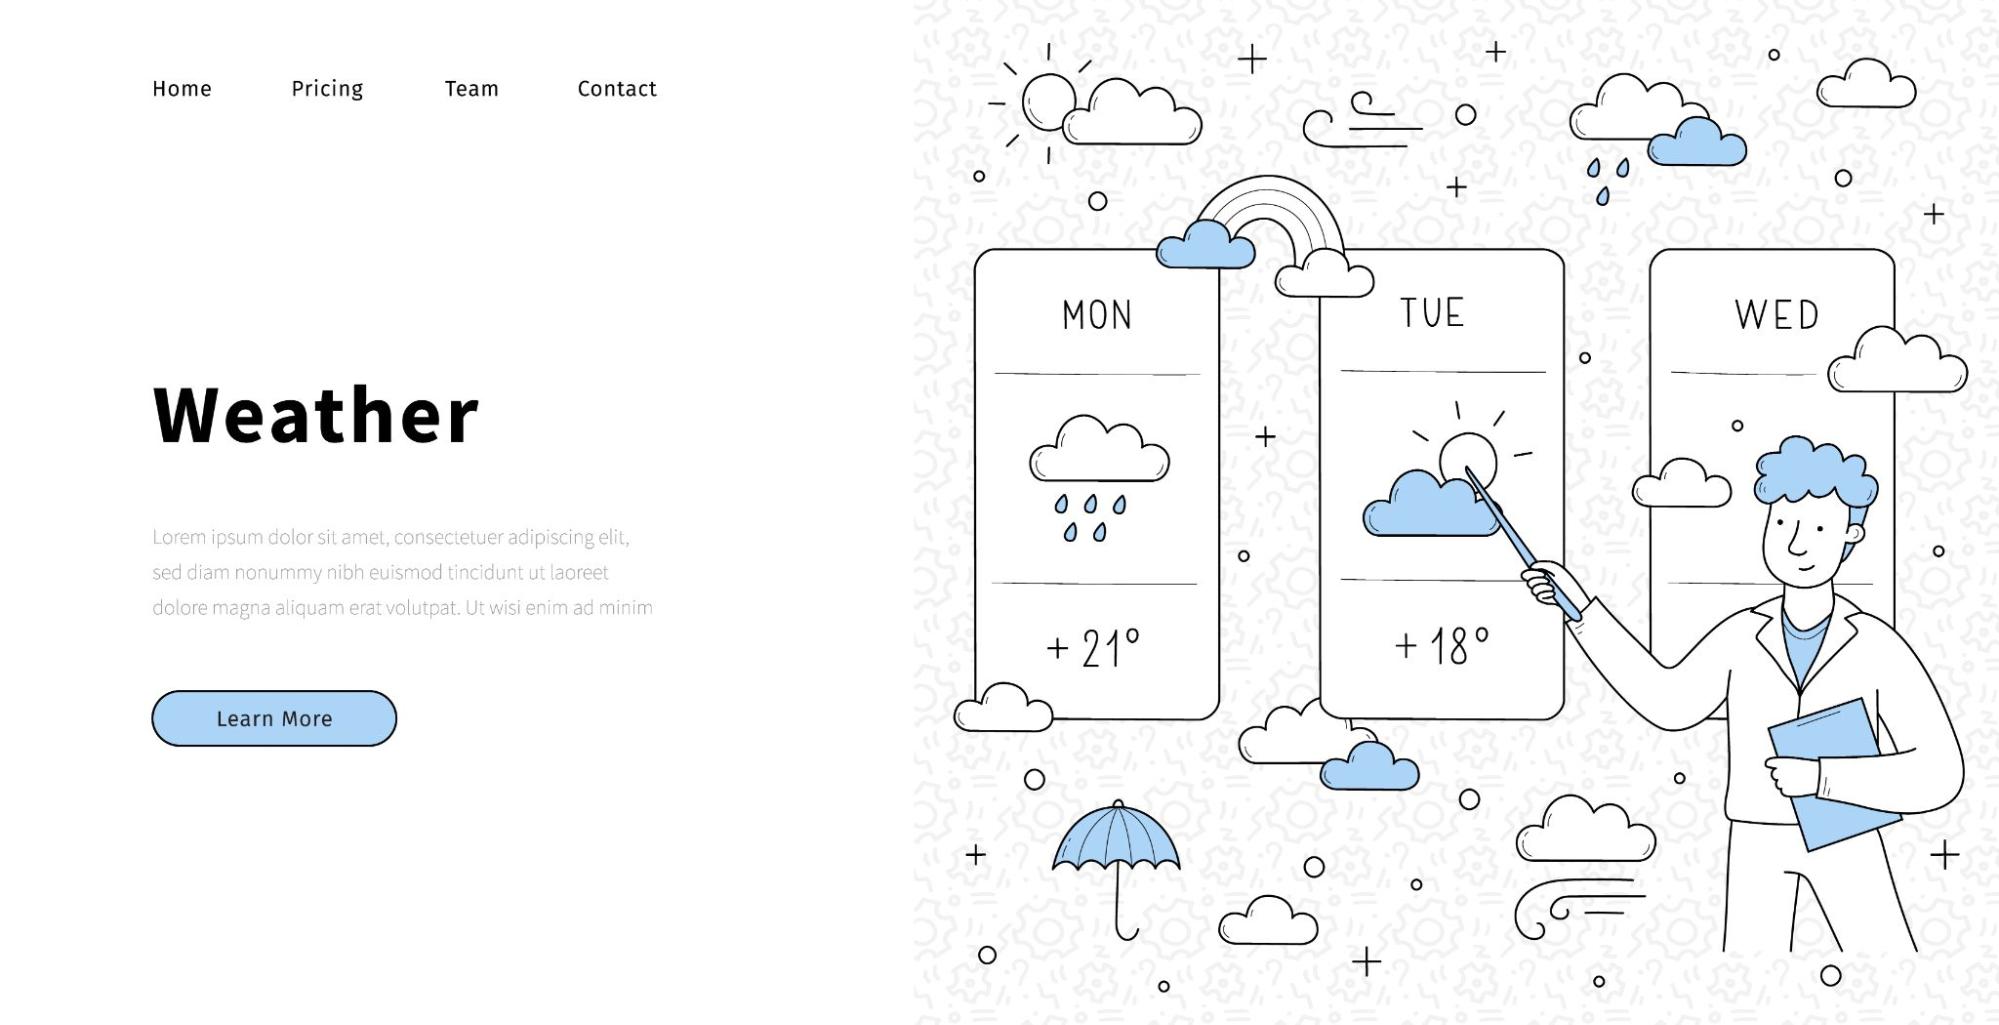
Temperature Ranges and Averages
In addition to PoP, weather forecasts often include temperature ranges and averages. These percentages indicate the range and average temperature that is likely to occur during the forecast period.
Weather forecasts often include temperature ranges and averages to provide an understanding of the expected temperatures during the forecast period.
Important details about Temperature Ranges and Averages:
- Temperature ranges define the span within which the temperature is likely to fluctuate during the forecast period. For example, a range of 75°F – 85°F suggests temperatures will vary between 75 and 85 degrees Fahrenheit;
- The average temperature represents the approximate midpoint of the temperature range. If the average temperature is 80°F, it implies that the temperatures will hover around 80 degrees Fahrenheit on average.
Considerations for Temperature Ranges and Averages:
- Temperature ranges help in planning outdoor activities and choosing appropriate clothing;
- Higher temperature ranges call for precautions like staying hydrated and avoiding prolonged sun exposure;
- Lower temperature ranges necessitate dressing in layers and protecting oneself from the cold.
Humidity Levels and Dew Points
Humidity levels and dew points are also important percentages included in weather forecasts. Humidity levels indicate how much moisture is present in the air, and dew points indicate the temperature at which dew or frost forms. For example, if the dew point is 50°F, then at a temperature of 50°F, dew or frost is expected to form. The higher the humidity level and dew point, the more uncomfortable the weather can be.
High humidity levels can make the air feel heavy and difficult to breathe, while low humidity levels can cause dry skin and other health issues. Similarly, high dew points can lead to uncomfortable levels of moisture in the air, while low dew points can cause dryness and irritation.
Understanding the percentages mentioned in weather forecasts can help us plan our activities and prepare for any upcoming weather changes. Whether it is the probability of precipitation, temperature ranges and averages, or humidity levels and dew points, these percentages provide us with valuable information that can help us stay safe and comfortable in any weather conditions.
Interesting facts:
- Other weather metrics include wind speed, atmospheric pressure, and visibility, which can provide further context and enhance our understanding of weather conditions;
- Weather forecasts are based on meteorological models and historical data, but they are subject to uncertainties and can evolve as new information becomes available;
- Localized weather patterns and geographical features can lead to variations in weather conditions, emphasizing the importance of region-specific forecasts.
How Meteorologists Calculate Percentages
Meteorologists use several methods to calculate weather percentages, including using weather models and data collection. They collect data from various sources such as surface observations, satellite data, radar data, and upper-level air observations. They use this information to create weather models that help them predict future weather conditions.
Analyzing Patterns and Trends
Meteorologists analyze patterns and trends in weather data to predict future weather conditions. They use tools such as barometric pressure, precipitation patterns, and temperature fluctuations to determine the likelihood of specific weather conditions occurring during the forecast period. These patterns and trends help meteorologists calculate weather percentages accurately.
Factoring in Local Topography and Climate
Local topography and climate also play a significant role in calculating weather percentages. The topography of an area can affect weather patterns, and local climate can influence the likelihood of particular weather conditions occurring. Meteorologists take these factors into account when calculating forecasts to ensure accuracy.

Interpreting Weather Forecast Percentages
When looking at percentages for rain and snow chances, it is essential to remember that they refer to the probability of precipitation, not how much precipitation is expected. A 20% chance of rain does not mean that there will be little rain; it merely indicates that rain is less likely to occur in 20% of the forecasted area compared to other regions.
Understanding Wind Speed and Direction Probabilities
Wind speed and direction probabilities indicate how likely it is to experience high or gusty winds during the forecast period. Higher percentages mean that higher wind speeds are expected to occur. Similarly, a north wind directional probability of 40% means that there is a 40% chance of wind originating from the north during the forecasted period.
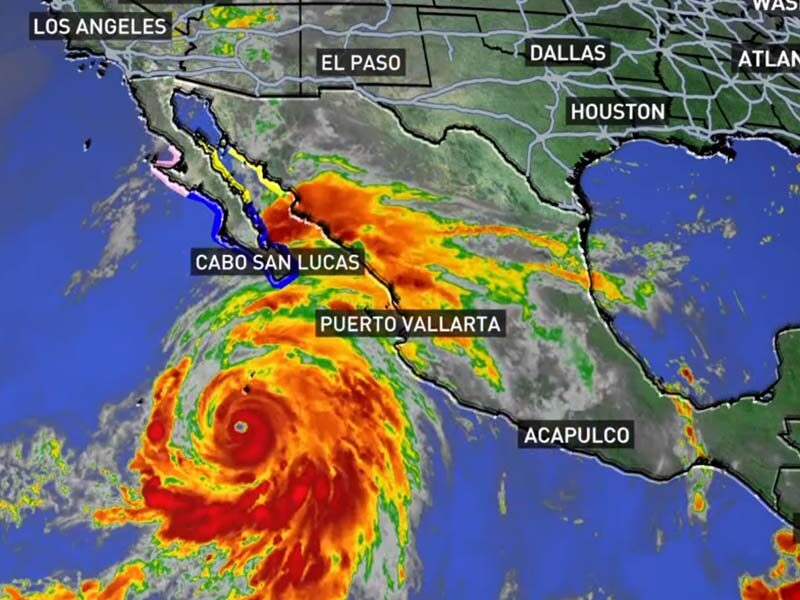
Assessing Severe Weather Risks
Some weather forecasts mention a risk of severe weather, including thunderstorms, tornadoes, hurricanes, and flash floods. The National Oceanic and Atmospheric Administration (NOAA) uses a severe weather risk scale that ranges from 1-5, with 5 being the most severe. Always take severe weather risks seriously and take necessary precautions when severe weather is expected.
Common Misconceptions About Weather Percentages
One of the most common misconceptions about weather percentages is that a 50% chance of rain means that it will rain for half of the day. However, it means that there is a 50% probability of rain in half of the forecasted area. The actual amount of rain may not be substantial, and it may only rain for a brief period instead of the entire day.
Misinterpreting Temperature Averages
Another common misconception is that an average temperature of 80°F means that it will be 80 degrees Fahrenheit throughout the forecast period. However, it means that the temperature will vary between high and low-temperature ranges and that the average temperature during the forecast period will be 80 degrees Fahrenheit.
Overestimating the Accuracy of Long-Range Forecasts
Finally, some people overestimate the accuracy of long-range forecasts. Long-range forecasts are less accurate than short-term forecasts and must be taken with a grain of salt. While meteorologists use past data and trends to predict future weather conditions, there are always uncertainties in weather forecasting, and long-range forecasts are subject to change.
Conclusion
Understanding weather forecast percentages can help us plan our daily lives better and stay safe during severe weather conditions. Meteorologists use several tools and methods to calculate weather forecasts, including weather models, data collection, analyzing patterns and trends, and factoring in local topography and climate. Interpreting percentages accurately requires us to look beyond the number and understand what they represent. By debunking common misconceptions and offering insights into key concepts related to weather forecasts, we hope that our readers will find this article informative and useful.